Comma Separated Values (.csv) or Tab Delimited Text (.txt):
These two formats are used for
concentration data,
peak intensity table, and
MS/NMR spectral bins. Samples can be in either rows or columns. Note,
-
Both sample or feature names must be unique and consist of a combination of common English letters, underscores
and numbers for naming purpose. Latin/Greek letters are not supported.
-
Statistical Analysis [one factor] module: for statistical analysis with one factor (two or multiple groups), class labels must immediately follow sample names;
Statistical Analysis [metadata table] module: for statistical analysis with multiple factors (including time series), users need to upload a separate metadata table;
-
For time-series data, the time-point group must be named as Time. In addition, the samples collected from the same subjects at different time points should be consecutive;
For more details, please see the screenshots demo for "Metadata / Time-series").
-
Data values (concentrations, bins, peak intensities) should contain only numeric and positive values (using empty or NA for
missing values). In addition, there should not be spaces between numbers. For instance, 1 600 should be formatted as 1600, if not
the value will get read as 1.
mzTab 2.0-M files (.mzTab)
MetaboAnalyst now supports the upload of mzTab files in the Statistical Analysis module.
MetaboAnalyst parses both the Metadata Table (MTD) and the Small Molecule Table (SML) to a MetaboAnalyst ready data table format. From the SML, users
can either choose to have their features named using the "chemical_name" or "theoretical_neutral_mass". If too many of these are missing however,
the features will be named with the "SML_ID". Further, if there are duplicate names, the "SML_ID" will be appended to the end of the selected feature identifier.
From the MTD, "study_variable" labeled "Blank" will be excluded from the final data table.
Note that MetaboAnalyst supports only mzTab-M 2.0 files that have been validated to ensure that the files can be read by our software.
Zipped files (.zip)
For NMR/MS peak list files and GC/LC-MS spectra data, users need to upload a
zipped folder containing data files from different groups under study (one file per spectrum and one
sub-folder for each group ). For paired comparison, users need to upload a separate text file
specifying the paired information.
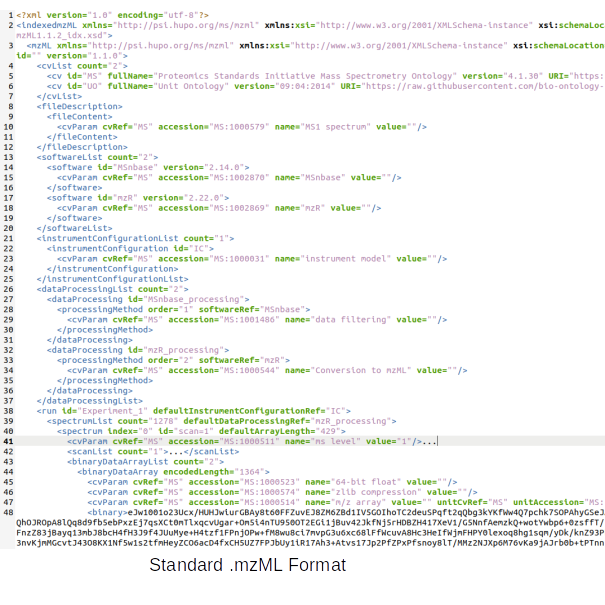
GC/LC-MS spectra must be in either NetCDF, mzXML, or mzDATA format. The spectra
should be stored in two separate folders according to their class labels then compressed into zip files. Please note, the program
is not compatible with the most recent WinZip (v12.0) with default option. Make sure to select the Legacy compression
(Zip 2.0 compatible) for compressing files. No space is allowed in either the folder names or the spectra names. The size
limit for each uploaded zip file is 50M. Please contact the author if you wish to upload a bigger data size.
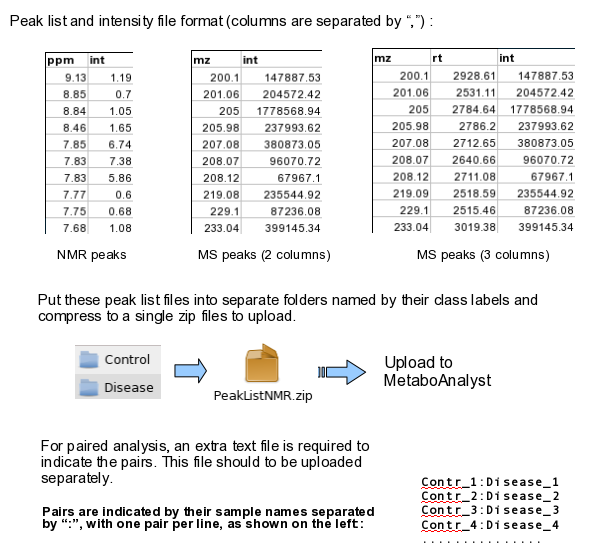
The peak list data is composed of peak list files organized into separate folders named by their class labels.
For example, if your data contains three groups, the peak list files should be organized into three folders accordingly.
Compress these folders into a single zip file then upload them to MetaboAnalyst.
NMR peak list files should contain two comma separated columns with the 1st column for peak
positions (ppm) and the 2nd column for peak intensities; MS peak list files can be in either two-column (mass and intensities)
or three-column format (mass, retention time and intensities), but not a mixture of both. The first line of each peak list file is reserved for
column labels. The file must be saved in comma separated values (.csv) format.
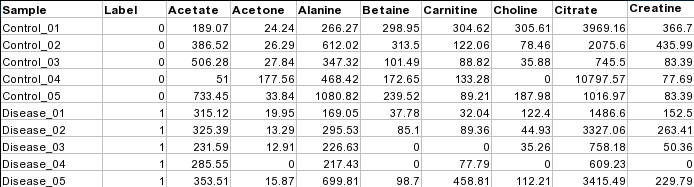
Samples in rows (unpaired)
Each row represents data from a sample. The class label is in the second column.
For unpaired comparisons, the class label can either be numeric (i.e. 0/1) or character (i.e. Healthy/Disease).
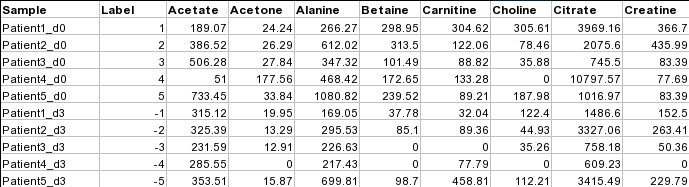
Samples in rows (paired)
For paired comparison, there must be an even (2n) number of samples.
The class labels are required to be the numeric integers between -1 and -n/2
and between 1 and n/2. Samples with class labels of the same absolute values are considered to be pairs.
In the example below, Patient1_d0 and Patient1_d3 are a pair.
Samples in columns (unpaired)
Samples can also be in columns and where each row represents a measured variable. The class label must be in the
second row. The requirements for class label is the same as that for samples in rows for both paired and unpaired
comparisons. The screenshot below shows the unpaired case.
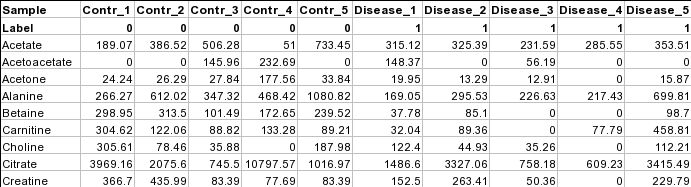
Samples in columns (paired)
The screenshot below shows a subset of binned NMR spectra data (bin width 0.04 ppm). In
this table, the samples from controls (e.g. Contr_1) are paired with the samples from the
subjects in disease (Disease_1) based on some criteria (i.e. age, weight, gender). Each sample
occupies a column and the second row is used for sample labels.
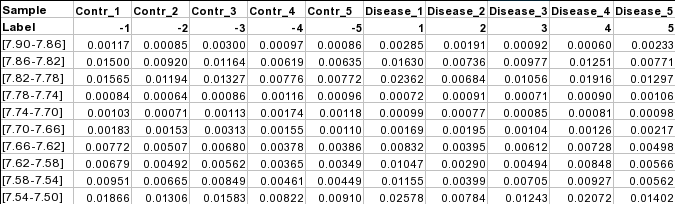
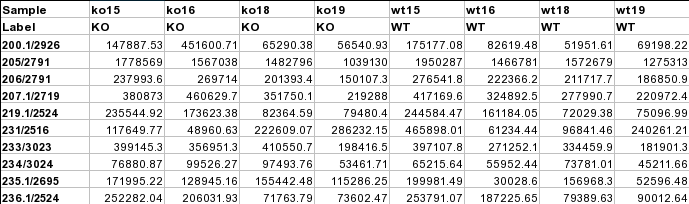
Peak intensity table
The screenshot below is a LC-MS peak intensity table. Each column represents peaks from a sample. These peaks
are grouped and identified by their retention time and mass. The class labels are in the second row
immediately following the sample names.
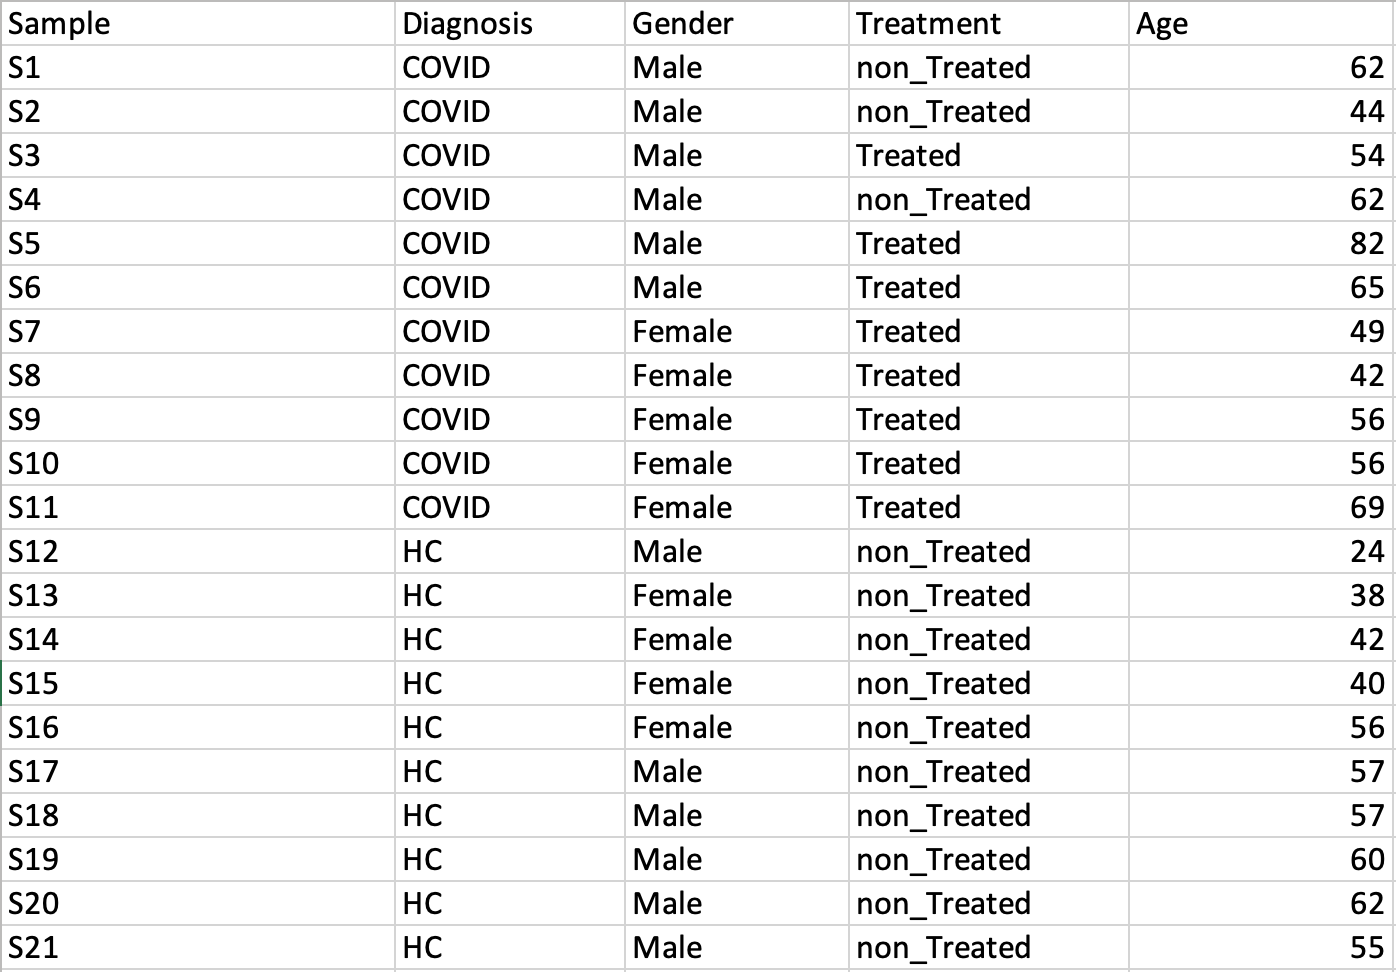
Metadata table containing multiple factors and covariates
This is a general table containing various descriptors for the data to be analyzed
-
The sample IDs must be identical to the metabolomics data;
-
The column after sample IDs should be the primary metadata of interest;
-
The metadata can contain either categorical (with at least three replicates per group) or continuous values (covariates);
-
Missing values are not allowed - you will be asked to manually "fix" the missing values if detected
A screenshot of a metadata table is shown below.
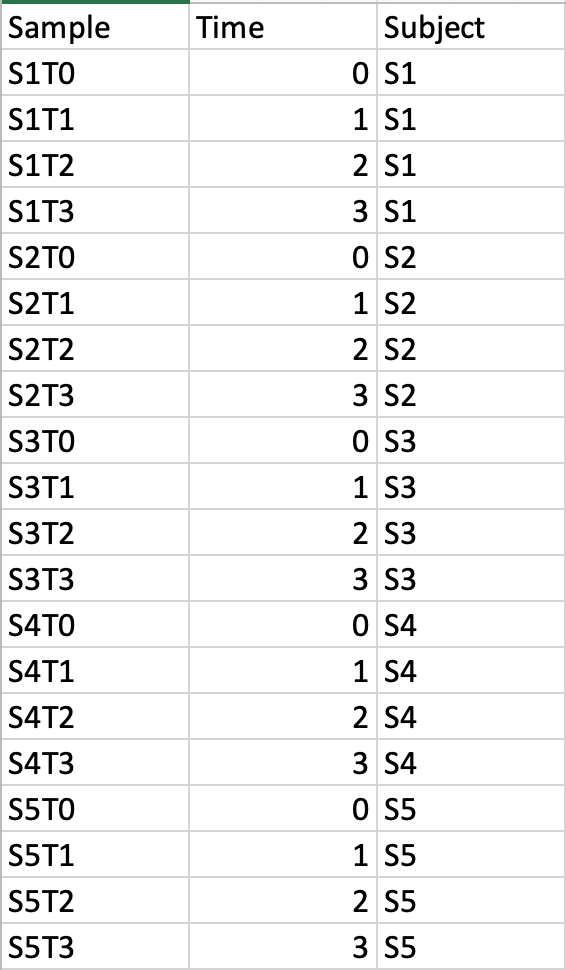
Time-series data only
This design requires two factors: the time points column must be labeled as Time;
the other label is Subject containing subject IDs across different time points.
Samples should be balanced (i.e. no missing time points for any subject).
A screenshot of an example data with samples in rows is shown below.
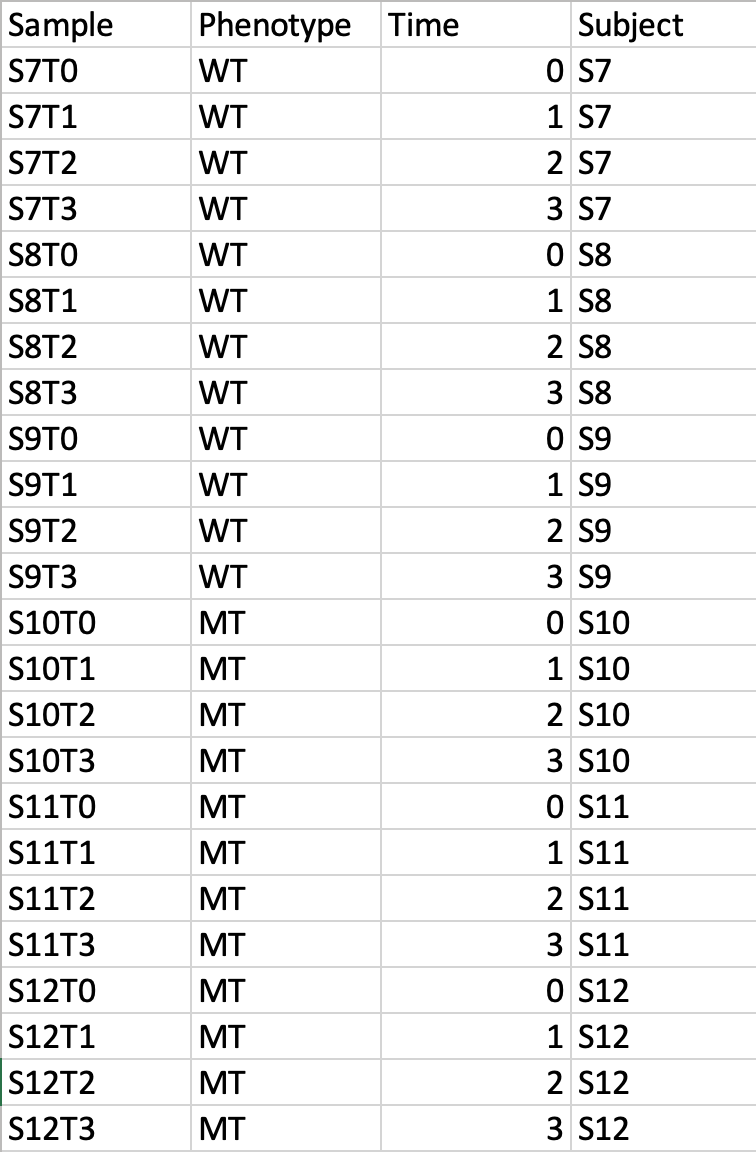
Time-series + one experimental factor
This design requires three factors: the experimental factor must be labeled as Phenotype;
the time points column must be labeled as Time;
the other label is Subject containing subject IDs across different time points.
The screenshot illustrates the appropriate structure of a time-series data table.
The data shown contains 24 samples measured at three time points from 6 subjects under two conditions (MT and WT)
For NMR/MS peak list files data, users need to upload a zipped folder containing data files from
different groups under study (one file per spectrum and one sub-folder for each group ).
For paired comparison, users need to upload a separate text file specifying the paired information.
The peak list data is composed of peak list files organized into separate folders named by their class labels.
For example, if your data contains three groups, the peak list files should be organized into three folders accordingly.
Compress these folders into a single zip file and then upload it to MetaboAnalyst.
NMR peak list files should contain two comma separated columns with the 1st column for peak
positions (ppm) and the 2nd column for peak intensities; MS peak list files can be in either two-column (mass and intensities)
or three-column format (mass, retention time and intensities), but not a mixture of both. The first line of each peak list file is reserved for
column labels. The file must be saved in comma separated values (.csv) format.
The paired sample information is encoded by using both sample names (without suffix) separated by a colon ":"
with one pair per line, and uploaded as a text file (.txt). The screen shot below illustrates the data
structure for peak list data as well as the specifications of paired samples:
Sample Preparation and Raw Spectra Acquisition
Here, we are sharing an in-house experimental protocol from our team to showcase how to prepare metabolomics samles and perform a standard LC-MS data acquisition.
This is an example of human islets case study. Click here to read the details.
Raw Spectra Data for Processing
-
LC-MS spectra must be in mzML, mzXML, or mzDATA format.
ProteoWizard - msconvert function can handle most common vendor formats.
-
Centroiding the MS data is required for online processing. This can be done during format conversion using ProteoWizard except NetCDF files.
To facilitate the process, we have developed CentroidMSData() function
(available in MetaboAnalystR) to centroid all common formats (including netCDF).
-
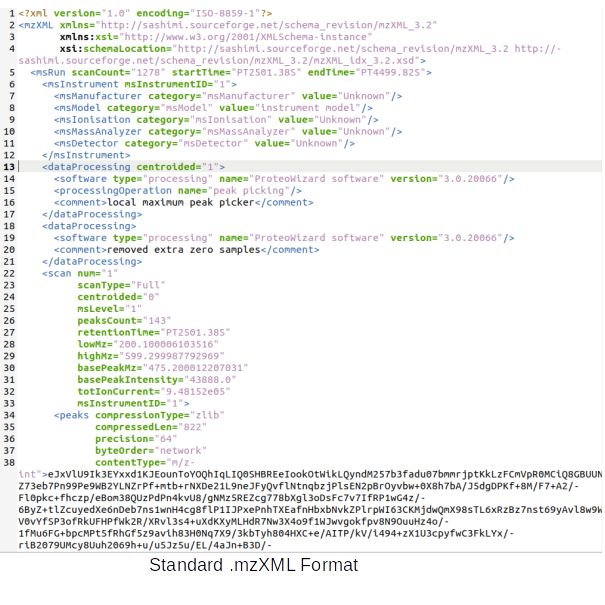
Only standard mzXML (example)
or mzML (example) can be accepted. Other non-standard mzXML or mzML will cause exceptions.
-
The size limit for each zip file is 200M for online processing. Use MetaboAnalystR for processing larger spectral files.
-
No spaces are allowed in spectra names. Use underscores instead (i.e. my_spectrum1.mzML)
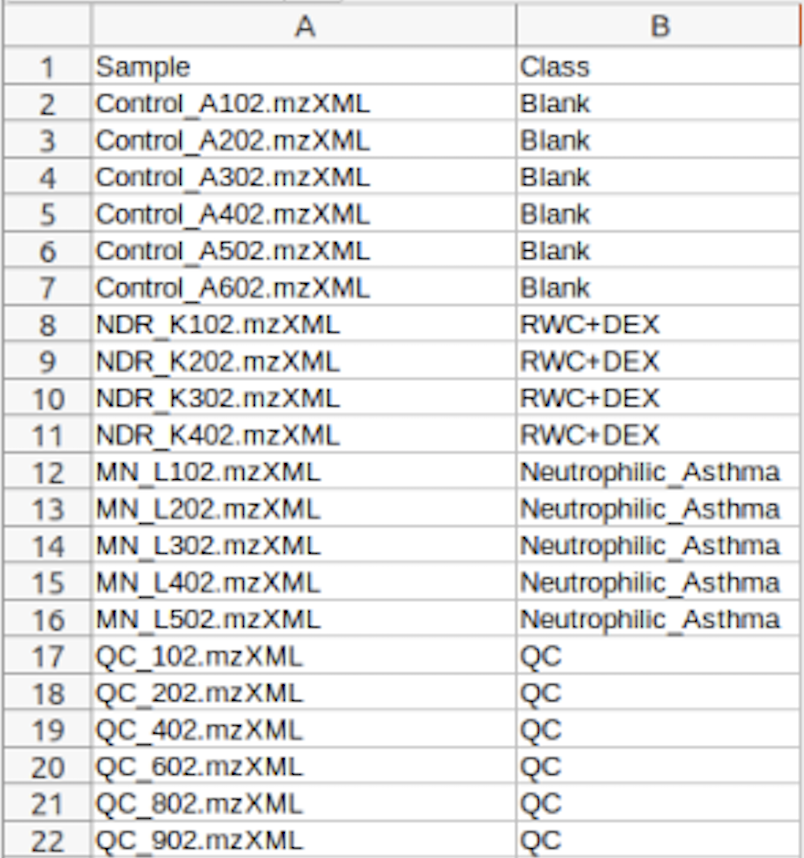
(Optional) Meta-data for raw spectra processing
A 2-columns metadata table (.txt only) is mandatory. The 1st column is the filenames of the spectra compressed above. 2nd column is the class/groups of all sample. No space is allowed in filenames or classes.
Please use "control_1" to replace "Control 1". For QC samples, the class/group name has to be "QC". At lease 3 samples for all groups are required except for QC. As for QC, it is strongly recommended to provide
at least 2 samples. Otherwise, 2 sample files with largest file size will be used for optimization.
Exploratory biomarker analysis
The data format is same as the one-factor data with samples in rows or columns, followed immediately by class labels.
Please note, ROC curve-based biomarker analysis is only defined for two-group analysis. If your data contains
multiple groups, you need to specify which two groups you want to investigate.
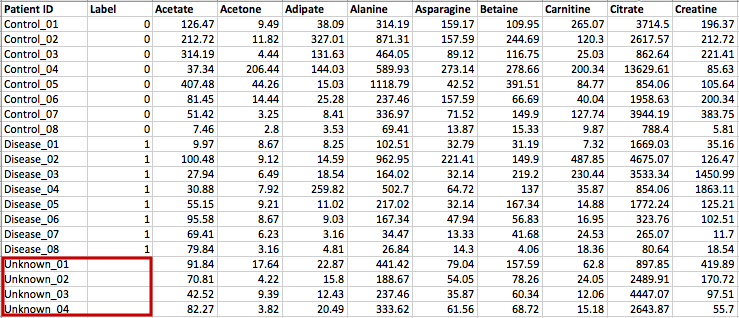
Creating biomarker models to predict new samples
You can create biomarker models to predict new samples (with unknown class) using the
ROC Tester. To do this, you need to upload a data that contains both the samples with class labels
and new samples whose class labels are empty for prediction. A screenshot is shown below.
The data format is the same as the one-factor data with samples in rows or columns, followed immediately by class labels.
Before uploading your data to the module, please make sure that the names of your features (compound names, spectral bins, peaks)
are consistent between the individual studies. At least 25% of the features must match between the studies. Also make sure that
the group labels are also consistent between the studies, i.e. Cancer and Healthy. Finally, all uploaded sample identifiers must
be unique.
A screenshot example is shown below:
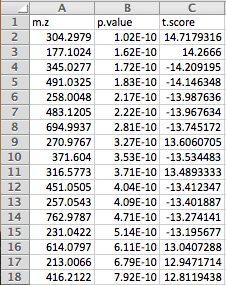
Peak list data format
Version 1 Peak Lists: The MS Peaks to Pathways module accepts either a three column table
containing the m/z features, p-values, and statistical scores,
a two-column table containing m/z features and either p-values or t-scores, or a one-column table ranked by either
p-values or t-scores. All inputted files must be in .txt format. If the input is a three column table, both the mummichog
and GSEA algorithms (and their combination) can be applied. If only p-values (or ranked by p-values) are provided,
then only the mummichog algorithm
will be applied. If only t-scores (or ranked by t-scores) are provided, then only the GSEA algorithm will be applied.
Version 2 Peak Lists: With Version 2 of the MS Peaks to Pathways module,
retention time can be included as a new column with the "rt" or "r.t" heading.
The maximum number of columns that can be uploaded is now 5: "m.z", "r.t", "p.value", "t.score" and "mode".
If p-values have not yet been calculated for their data, users can use the exploratory statistical analysis module
to upload their raw peak tables, process the data, perform t-tests or fold-change analysis, and then upload these
results into the module. An example dataset is shown below:
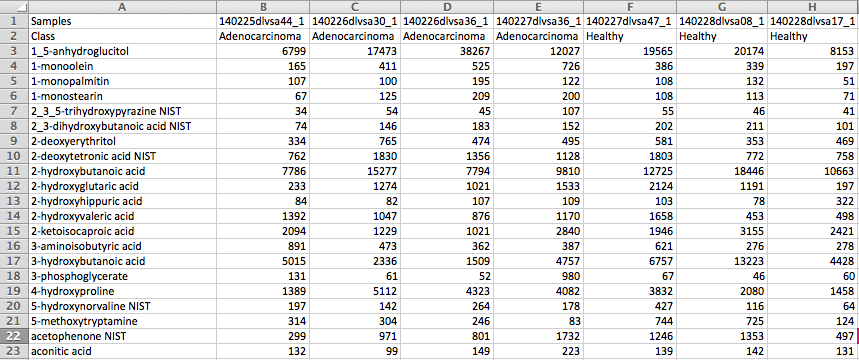
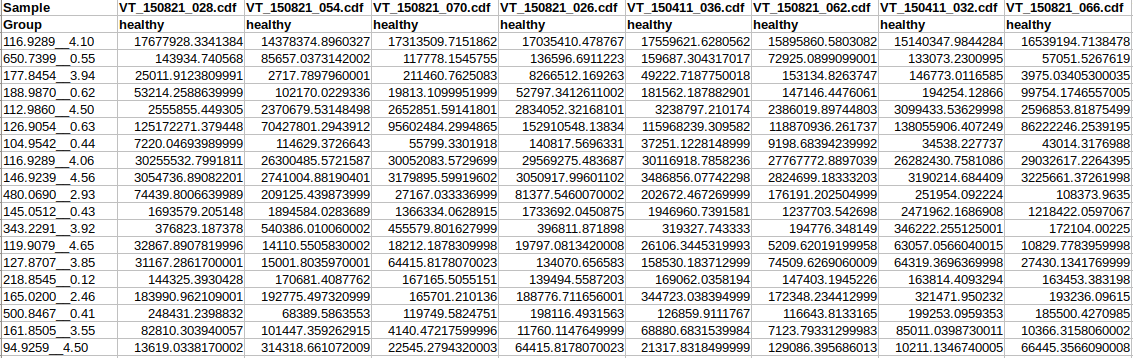
Peak table format
Upload your data in either a tab-deliminted (.txt) or comma-separated (.csv) format. The MS Peaks to Pathways module accepts
either a generic peak table or the MZmine formatted peak table. For Version 2, retention times can be included in the
generic peak table and should be formatted so that the peak and retention time are separated by two underscores. An example of the
generic peak table with retention time is shown below:
Data format overview
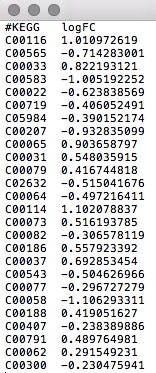
Metabolite or gene list data: a list of metabolite or gene IDs with optional fold-changes. Each feature should be in
in a row. Please refer to the example data for further details.
Metabolite/Gene list labels
It is critical for your data to be properly labeled so they can be uploaded into the Joint Pathway Analysis or Network Explorer module.
The following common metabolite and gene IDs are supported:
-
Metabolite list: Common compound names, HMDB IDs, or KEGG compound IDs as metabolite identifiers.
-
Genelist: Entrez IDs, Ensembl Gene IDs, official gene symbols, or KEGG orthologs (KOs) are currently supported.
An example of what your data should look like in any text editor (WordPad, TextEdit) is shown in the screenshot below.


